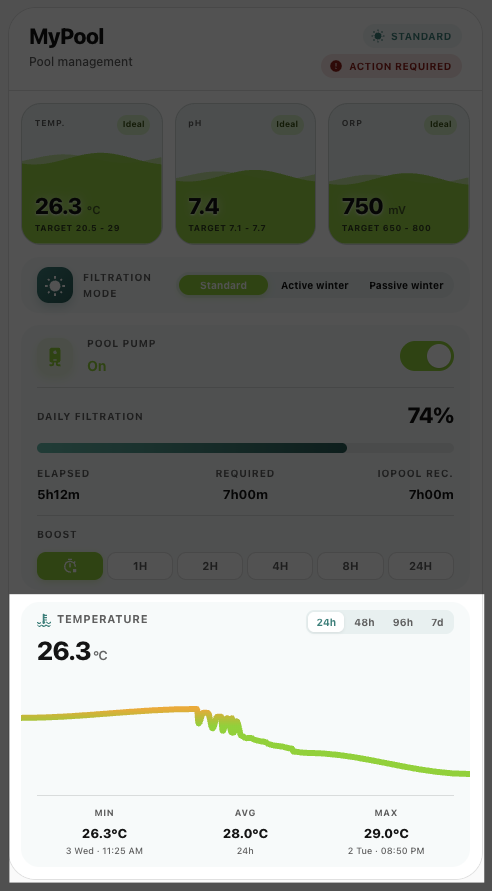
Temperature chart
The native SVG chart used to display temperature history.
The temperature chart renders the sensor history as a native SVG plot.
- It supports 24h, 48h, 96h, and 7d windows.
- It shows min, average, and max statistics under the graph.
- Hover or tap to inspect a point in the history.
Screenshot